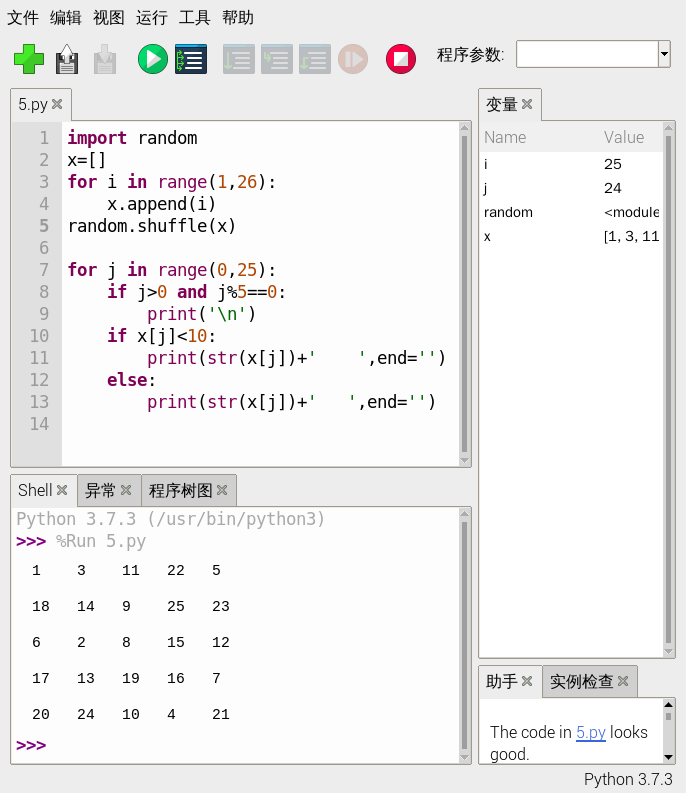
今天应儿子要求比赛专注程度,也就是将1-25个数字打乱后分配在5*5的格子里,然后比谁先能按数字顺序数完,失败多次后,我觉得他写的字不容易辨识,随后他提出我写个程序打印出来公平竞赛,写了python程序如下:
import random
x=[]
for i in range(1,26):
    x.append(i)
random.shuffle(x)
for j in range(0,25):
    if j>0 and j%5==0:
        print('\n')
    if x[j]<10:
        print(str(x[j])+'    ',end='')
    else:
        print(str(x[j])+'   ',end='')
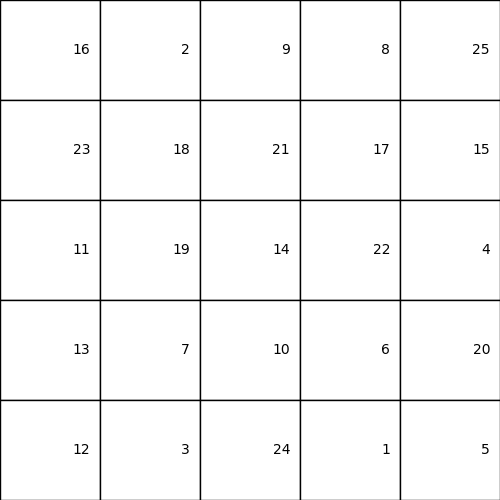
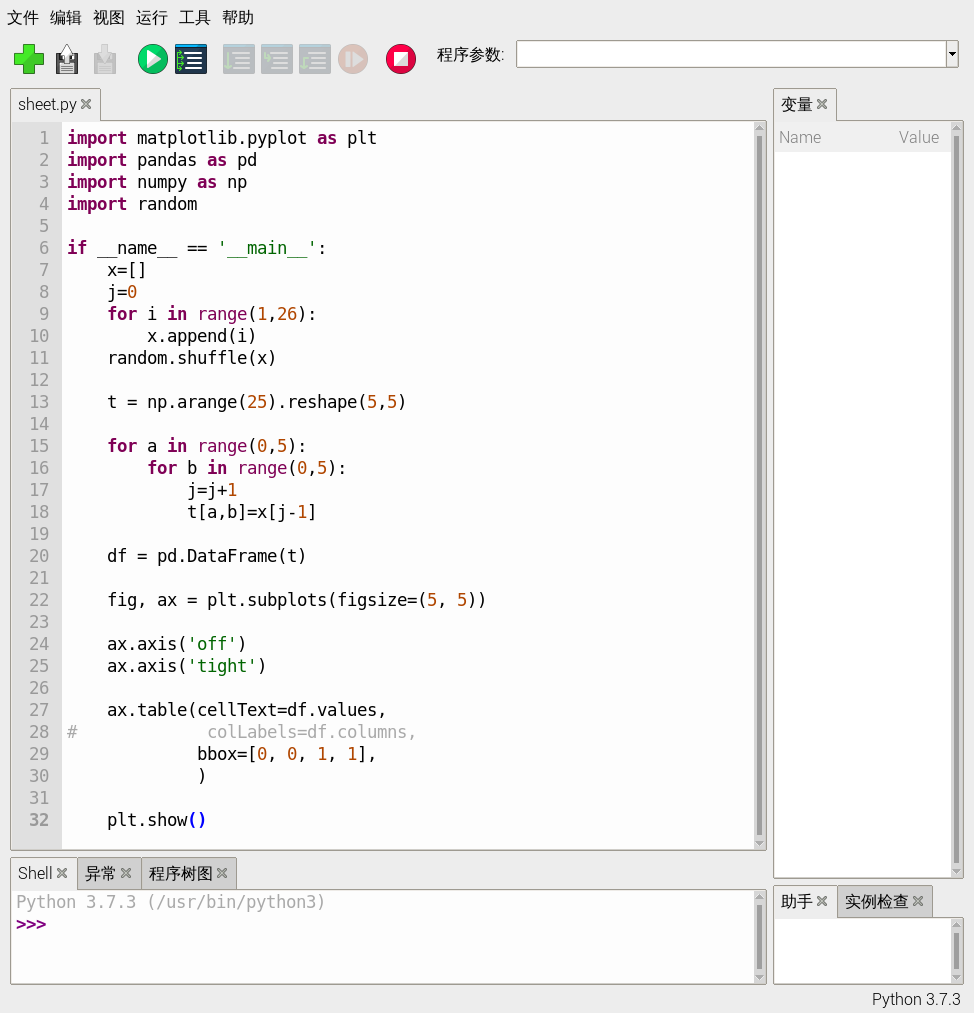
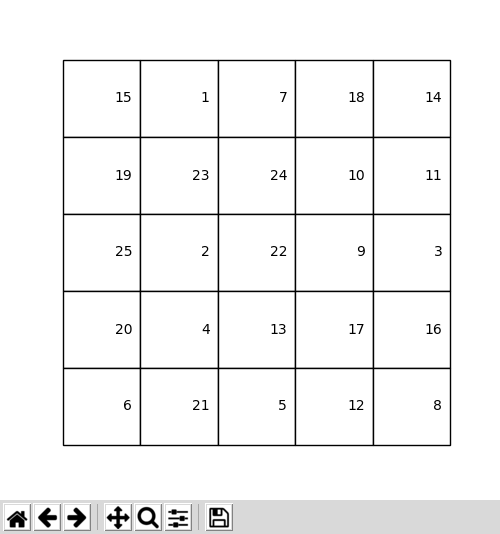
如果希望打印出来在纸上比试,可以
import matplotlib.pyplot as plt
import pandas as pd
import numpy as np
import random
if __name__ == '__main__':
    x=[]
    j=0
    for i in range(1,26):
        x.append(i)
    random.shuffle(x)
    t = np.arange(25).reshape(5,5)
    for a in range(0,5):
        for b in range(0,5):
            j=j+1
            t[a,b]=x[j-1]
    df = pd.DataFrame(t)
    fig, ax = plt.subplots(figsize=(5, 5))
    ax.axis('off')
    ax.axis('tight')
    ax.table(cellText=df.values,
#             colLabels=df.columns,
             bbox=[0, 0, 1, 1],
             )
    plt.show()
    如想去掉底部的工具栏并修改标题,代码如下:
import matplotlib.pyplot as plt
import pandas as pd
import numpy as np
import random
if __name__ == '__main__':
    x=[]
    j=0
    for i in range(1,26):
        x.append(i)
    random.shuffle(x)
    t = np.arange(25).reshape(5,5)
    for a in range(0,5):
        for b in range(0,5):
            j=j+1
            t[a,b]=x[j-1]
    df = pd.DataFrame(t)
    plt.rcParams['toolbar'] = 'None'
    fig,ax=plt.subplots(num="注意力测试",
           figsize=(5, 5),
           dpi=100,
           facecolor="white",
           edgecolor='green')
    ax.axis('off')
    ax.table(cellText=df.values,
             bbox=[0, 0, 1, 1],
             )
    plt.show()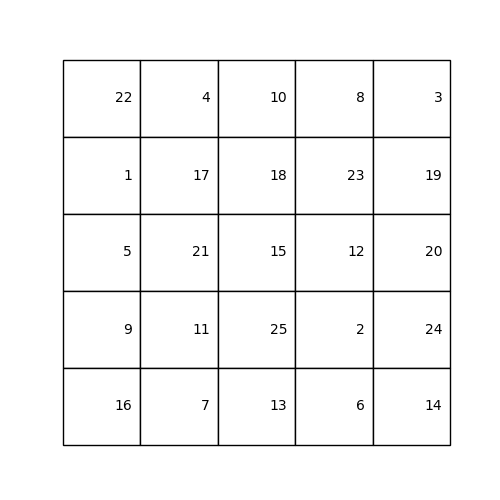
某些人对图像边框特别敏感,下面的代码去掉了图像白边:
import matplotlib.pyplot as plt
import pandas as pd
import numpy as np
import random
if __name__ == '__main__':
    x=[]
    j=0
    for i in range(1,26):
        x.append(i)
    random.shuffle(x)
    t = np.arange(25).reshape(5,5)
    for a in range(0,5):
        for b in range(0,5):
            j=j+1
            t[a,b]=x[j-1]
    df = pd.DataFrame(t)
    plt.rcParams['toolbar'] = 'None'
    fig,ax=plt.subplots(num="注意力测试",
           figsize=(5, 5),
           dpi=100,
           facecolor="white",
           edgecolor='black')
    ax.axis('off')
    # 去除图像周围的白边
    plt.subplots_adjust(top=1, bottom=0, left=0, right=1, hspace=0, wspace=0)
    ax.axis('tight')
    ax.table(cellText=df.values,
             bbox=[0, 0, 1, 1],
             )
    plt.show()